Trace
Altimate Code captures detailed traces (session recordings) of every session, including LLM generations, tool calls, token usage, cost, and timing, and saves them locally as JSON files. Traces are invaluable for debugging agent behavior, optimizing cost, and understanding how the agent solves problems.
Tracing is enabled by default and requires no configuration. Traces are stored locally and never leave your machine unless you configure a remote exporter.
Quick Start
# Run a prompt (trace is saved automatically)
altimate-code run "optimize my most expensive queries"
# → Trace saved: ~/.local/share/altimate-code/traces/abc123.json

# List recent traces
altimate-code trace list

# View a trace in the browser
altimate-code trace view abc123
What's Captured
Each trace records the full agent session:
| Data | Description |
|---|---|
| Generations | Each LLM call with model, provider, finish reason, and variant |
| Token usage | Input, output, reasoning, cache read, and cache write tokens per generation |
| Cost | Per-generation and total session cost in USD |
| Tool calls | Every tool invocation with input, output, duration, and status |
| Timing | Start/end timestamps for every span (session, generation, tool) |
| Errors | Error messages and status on failed tool calls or generations |
| Metadata | Model, provider, agent, prompt, user ID, environment, tags |
| Loop Detection | Automatic detection of repeated tool call patterns |
| Post-Session Summary | AI-generated summary of the session's key actions and outcomes |
Data Engineering Attributes
When using SQL and dbt tools, traces automatically capture domain-specific data:
| Category | Examples |
|---|---|
| Warehouse | Bytes scanned/billed, execution time, queue time, partitions pruned, cache hits, query ID, estimated cost |
| SQL | Query text, dialect, validation results, lineage (input/output tables), schema changes |
| dbt | Command, model status, materialization, rows affected, compiled SQL, test results, Jinja errors |
| Data Quality | Row counts, null percentages, freshness, anomaly detection |
| Cost Attribution | LLM cost + warehouse compute cost + storage delta = total cost, per user/team/project |
These attributes are purely optional. Traces are valid without them. They're populated automatically by tools that have access to warehouse metadata.
Configuration
Add to your config file (~/.config/altimate-code/altimate-code.json or project-level altimate-code.json):
{
  "tracing": {
    "enabled": true,
    "dir": "~/.local/share/altimate-code/traces/",
    "maxFiles": 100,
    "exporters": []
  }
}
| Option | Type | Default | Description |
|---|---|---|---|
enabled |
boolean |
true |
Enable or disable tracing |
dir |
string |
~/.local/share/altimate-code/traces/ |
Custom directory for trace files |
maxFiles |
number |
100 |
Max trace files to keep (oldest pruned automatically). Set to 0 for unlimited |
exporters |
array |
[] |
Remote HTTP exporters (see below) |
Disabling Tracing
Or per-run with the --no-trace flag:
Viewing Traces
List Traces
Shows a table of recent traces with session ID, timestamp, duration, tokens, cost, tool calls, and status.
SESSION              WHEN       DURATION   TOKENS     COST       TOOLS  STATUS     PROMPT
abc123def456         2m ago     45.2s      12,500     $0.0150    8      ok         optimize my most expensive queries
xyz789abc012         1h ago     12.8s      3,200      $0.0040    3      ok         explain this model
err456def789         3h ago     5.1s       1,800      $0.0020    2      error      run dbt tests
Options:
| Flag | Description |
|---|---|
-n, --limit |
Number of traces to show (default: 20) |
View a Trace
Opens a local web server with an interactive trace viewer in your browser.
The viewer has 5 tabs:
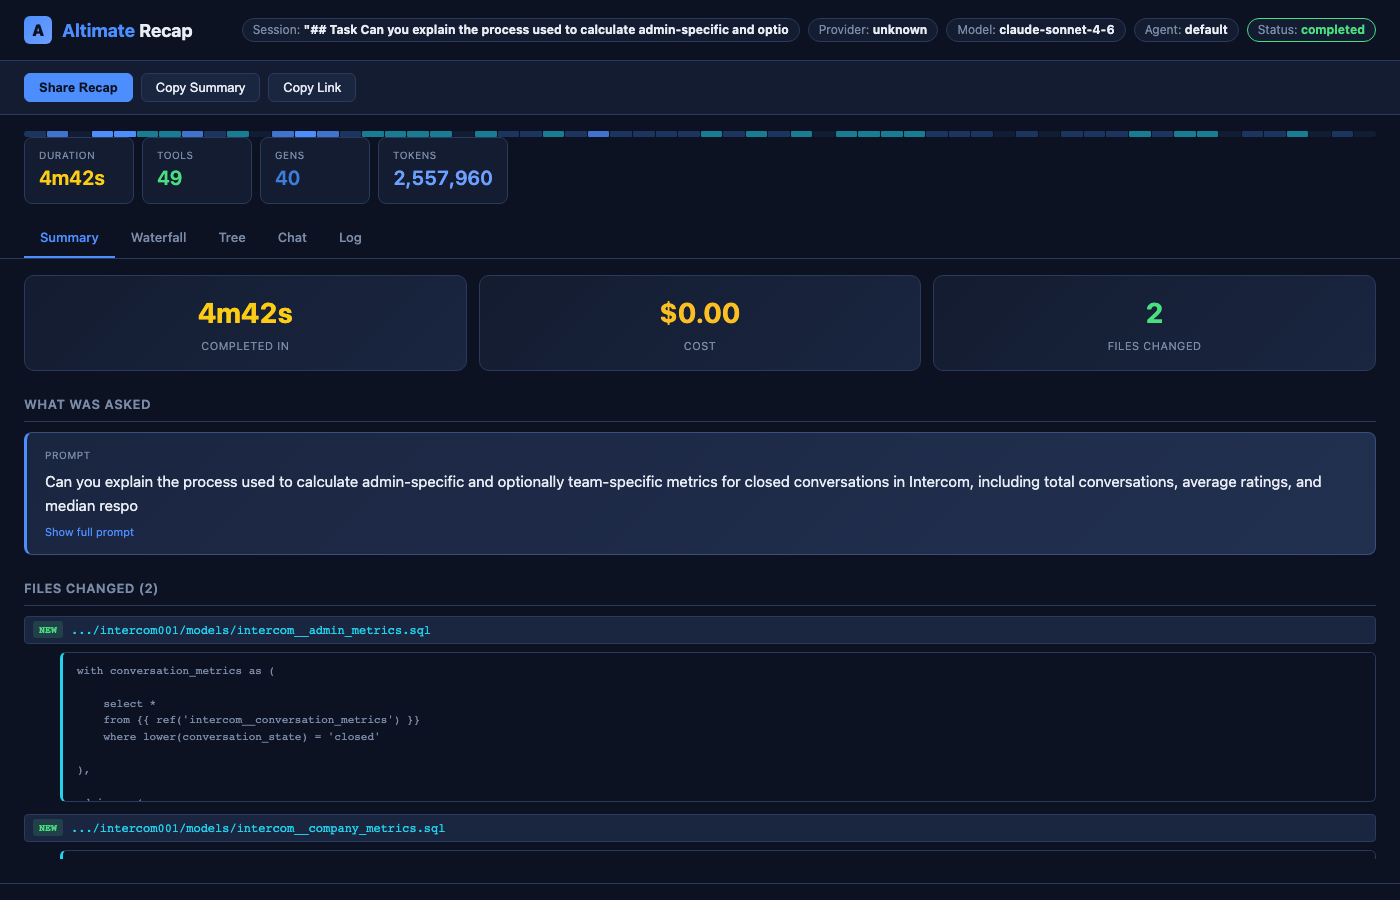
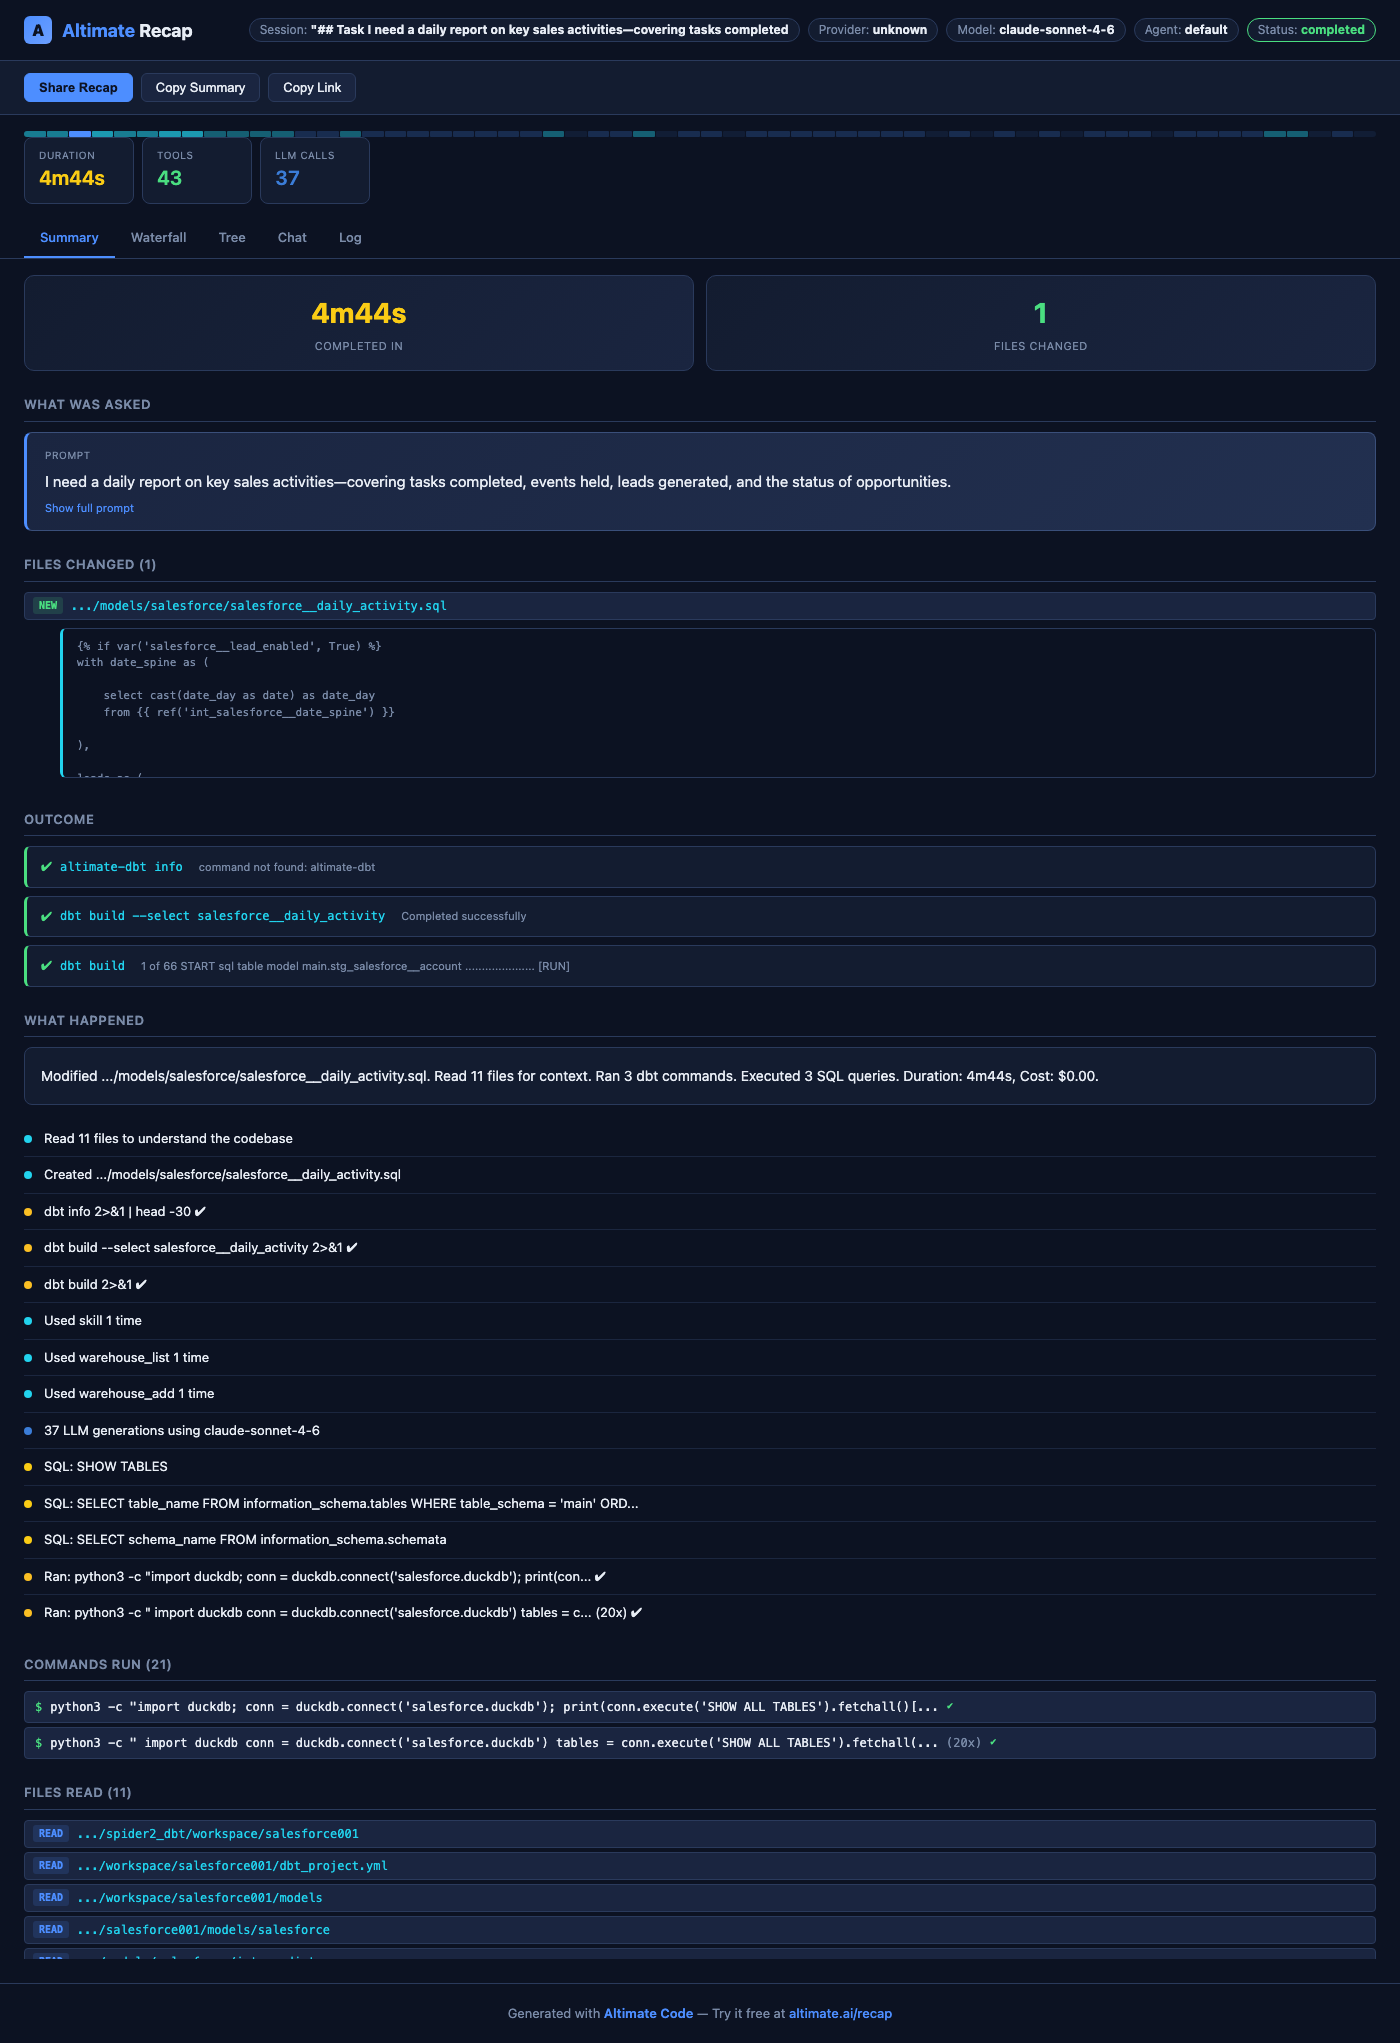
- Summary (default) — The story of the session: what was asked, files changed with diff previews, outcome (dbt/pytest/Airflow results), what happened timeline, and cost breakdown
- Waterfall — Gantt-style timeline bars for every span, color-coded by type
- Tree — Nested indentation view showing parent/child span relationships
- Chat — Conversation flow with user prompt and agent responses
- Log — Flat chronological list of all events
The Summary tab shows what matters most to data engineers:
- What was asked — Your prompt, truncated with expand toggle
- Files changed — Each file with NEW/EDIT badge and SQL diff preview
- Outcome — dbt build results, test results, SQL query results (clickable to jump to waterfall)
- What happened — Smart timeline grouping boring commands, showing meaningful actions
- Loop warnings — Automatic detection when the agent repeats the same tool call
- Cost details — Collapsible token breakdown with visual bar chart
Options:
| Flag | Description |
|---|---|
--port |
Port for the viewer server (default: random) |
--live |
Auto-refresh every 2s for in-progress sessions |
Partial session ID matching is supported. For example, altimate-code trace view abc matches abc123def456.
Live Viewing (In-Progress Sessions)
Traces are written incrementally. After every tool call and generation, a snapshot is flushed to disk. This means you can view a trace while the session is still running:
# In terminal 1: run a long task
altimate-code run "refactor the entire pipeline"

# In terminal 2: watch the trace live
altimate-code trace view <session-id> --live
The --live flag adds a green "LIVE" indicator and polls for updates every 2 seconds. The page auto-refreshes when new spans appear.
From the TUI
Type /trace in the TUI to open a trace history dialog listing all recent sessions. Select any trace to open it in your browser with the interactive viewer. The current session appears at the top, and traces are grouped by date with duration and timestamp info.
The viewer launches in live mode automatically for in-progress sessions, so you can watch spans appear as the agent works.
Sharing Traces
The trace viewer includes a Share Trace button that exports a self-contained HTML file. This file includes all session data and can be opened in any browser without a server — perfect for sharing with teammates, attaching to tickets, or archiving sessions.
Remote Exporters
Traces can be sent to remote backends via HTTP POST. Each exporter receives the full trace JSON on session completion.
{
  "tracing": {
    "exporters": [
      {
        "name": "my-backend",
        "endpoint": "https://api.example.com/v1/traces",
        "headers": {
          "Authorization": "Bearer <token>"
        }
      }
    ]
  }
}
| Field | Type | Description |
|---|---|---|
name |
string |
Identifier for this exporter (used in logs) |
endpoint |
string |
HTTP endpoint to POST trace JSON to |
headers |
object |
Custom headers (e.g., auth tokens) |
How it works:
- All exporters run concurrently with the local file write via
Promise.allSettled - A failing exporter never blocks local file storage or other exporters
- If the server responds with
{ "url": "..." }, the URL is displayed to the user - Exporters have a 10-second timeout
- All export operations are best-effort and never crash the CLI
Trace File Format
Traces are stored as JSON files in the traces directory. The schema is versioned for forward compatibility.
{
  "version": 2,
  "traceId": "019cf4e2-...",
  "sessionId": "session-abc123",
  "startedAt": "2026-03-15T10:00:00.000Z",
  "endedAt": "2026-03-15T10:00:45.200Z",
  "metadata": {
    "model": "anthropic/claude-sonnet-4-20250514",
    "providerId": "anthropic",
    "agent": "builder",
    "variant": "high",
    "prompt": "optimize my most expensive queries",
    "userId": "user@example.com",
    "environment": "production",
    "version": "2.0.0",
    "tags": ["benchmark", "nightly"]
  },
  "spans": [
    {
      "spanId": "...",
      "parentSpanId": null,
      "name": "session-abc123",
      "kind": "session",
      "startTime": 1710500000000,
      "endTime": 1710500045200,
      "status": "ok"
    },
    {
      "spanId": "...",
      "parentSpanId": "<session-span-id>",
      "name": "generation-1",
      "kind": "generation",
      "startTime": 1710500000100,
      "endTime": 1710500003500,
      "status": "ok",
      "model": {
        "modelId": "anthropic/claude-sonnet-4-20250514",
        "providerId": "anthropic"
      },
      "finishReason": "stop",
      "cost": 0.005,
      "tokens": {
        "input": 1500,
        "output": 300,
        "reasoning": 100,
        "cacheRead": 200,
        "cacheWrite": 50,
        "total": 2150
      }
    },
    {
      "spanId": "...",
      "parentSpanId": "<generation-span-id>",
      "name": "sql_execute",
      "kind": "tool",
      "startTime": 1710500001000,
      "endTime": 1710500003000,
      "status": "ok",
      "tool": { "callId": "call-1", "durationMs": 2000 },
      "input": { "query": "SELECT ..." },
      "output": "10 rows returned",
      "attributes": {
        "de.warehouse.system": "snowflake",
        "de.warehouse.bytes_scanned": 45000000,
        "de.warehouse.estimated_cost_usd": 0.0012,
        "de.sql.validation.valid": true
      }
    }
  ],
  "summary": {
    "totalTokens": 2150,
    "totalCost": 0.005,
    "totalToolCalls": 1,
    "totalGenerations": 1,
    "duration": 45200,
    "status": "completed",
    "tokens": {
      "input": 1500,
      "output": 300,
      "reasoning": 100,
      "cacheRead": 200,
      "cacheWrite": 50
    }
  }
}
Span Types
| Kind | Description | Key Fields |
|---|---|---|
session |
Root span for the entire session | input (prompt), output (summary) |
generation |
One LLM call (step-start to step-finish) | model, finishReason, tokens, cost |
tool |
A tool invocation | tool.callId, tool.durationMs, input, output |
Domain Attribute Namespaces
All domain-specific attributes use the de.* prefix and are stored in the attributes map on tool spans:
| Prefix | Domain |
|---|---|
de.warehouse.* |
Warehouse metrics (bytes, credits, partitions, timing) |
de.sql.* |
SQL quality (validation, lineage, schema changes) |
de.dbt.* |
dbt operations (model status, tests, Jinja, DAG) |
de.quality.* |
Data quality (row counts, freshness, anomalies) |
de.cost.* |
Cost attribution (LLM + warehouse + storage) |
Crash Recovery
Traces are designed to survive process crashes:
-
Immediate snapshot. A trace file is written as soon as the session starts, before any LLM interaction. Even if the process crashes immediately, a minimal trace file exists.
-
Incremental snapshots. After every tool call and generation completion, the trace file is updated atomically (write to temp file, then rename). The file on disk always contains a valid, complete JSON document.
-
Crash handlers. The
runandservecommands registerSIGINT/SIGTERM/beforeExithandlers that finalize in-flight traces on shutdown. (runflushes synchronously with a"crashed"status;servedrains and finalizes its active sessions.) -
Status indicators. Trace status tells you exactly what happened:
| Status | Meaning |
|---|---|
completed |
Session finished normally |
error |
Session finished with an error |
running |
Session is still in progress (visible in live mode) |
crashed |
Process was interrupted before the session completed |
Crashed traces contain all data up to the last successful snapshot. You can view them normally with altimate-code trace view.
Historical Traces
All traces are stored in the traces directory and persist across sessions. Use trace list to browse history:
# Show the last 50 traces
altimate-code trace list -n 50

# Navigate to the next page
altimate-code trace list --offset 50 -n 50

# View any historical trace
altimate-code trace view <session-id>
Traces are automatically pruned when maxFiles is exceeded (default: 100). The oldest traces are removed first. Set maxFiles: 0 for unlimited retention.
Privacy
Traces are stored locally only by default. They contain:
- The prompt you sent
- Tool inputs and outputs (SQL queries, file contents, command results)
- Model responses
If you configure remote exporters, trace data is sent to those endpoints. No trace data is included in the anonymous telemetry described in Telemetry.
Sensitive Data
Traces may contain SQL queries, file paths, and command outputs from your session. If you share trace files or configure remote exporters, be aware that this data will be included.