Warehouses
Track every warehouse's cost and savings in one place, then turn on Auto Tune per warehouse to cut idle spend automatically.
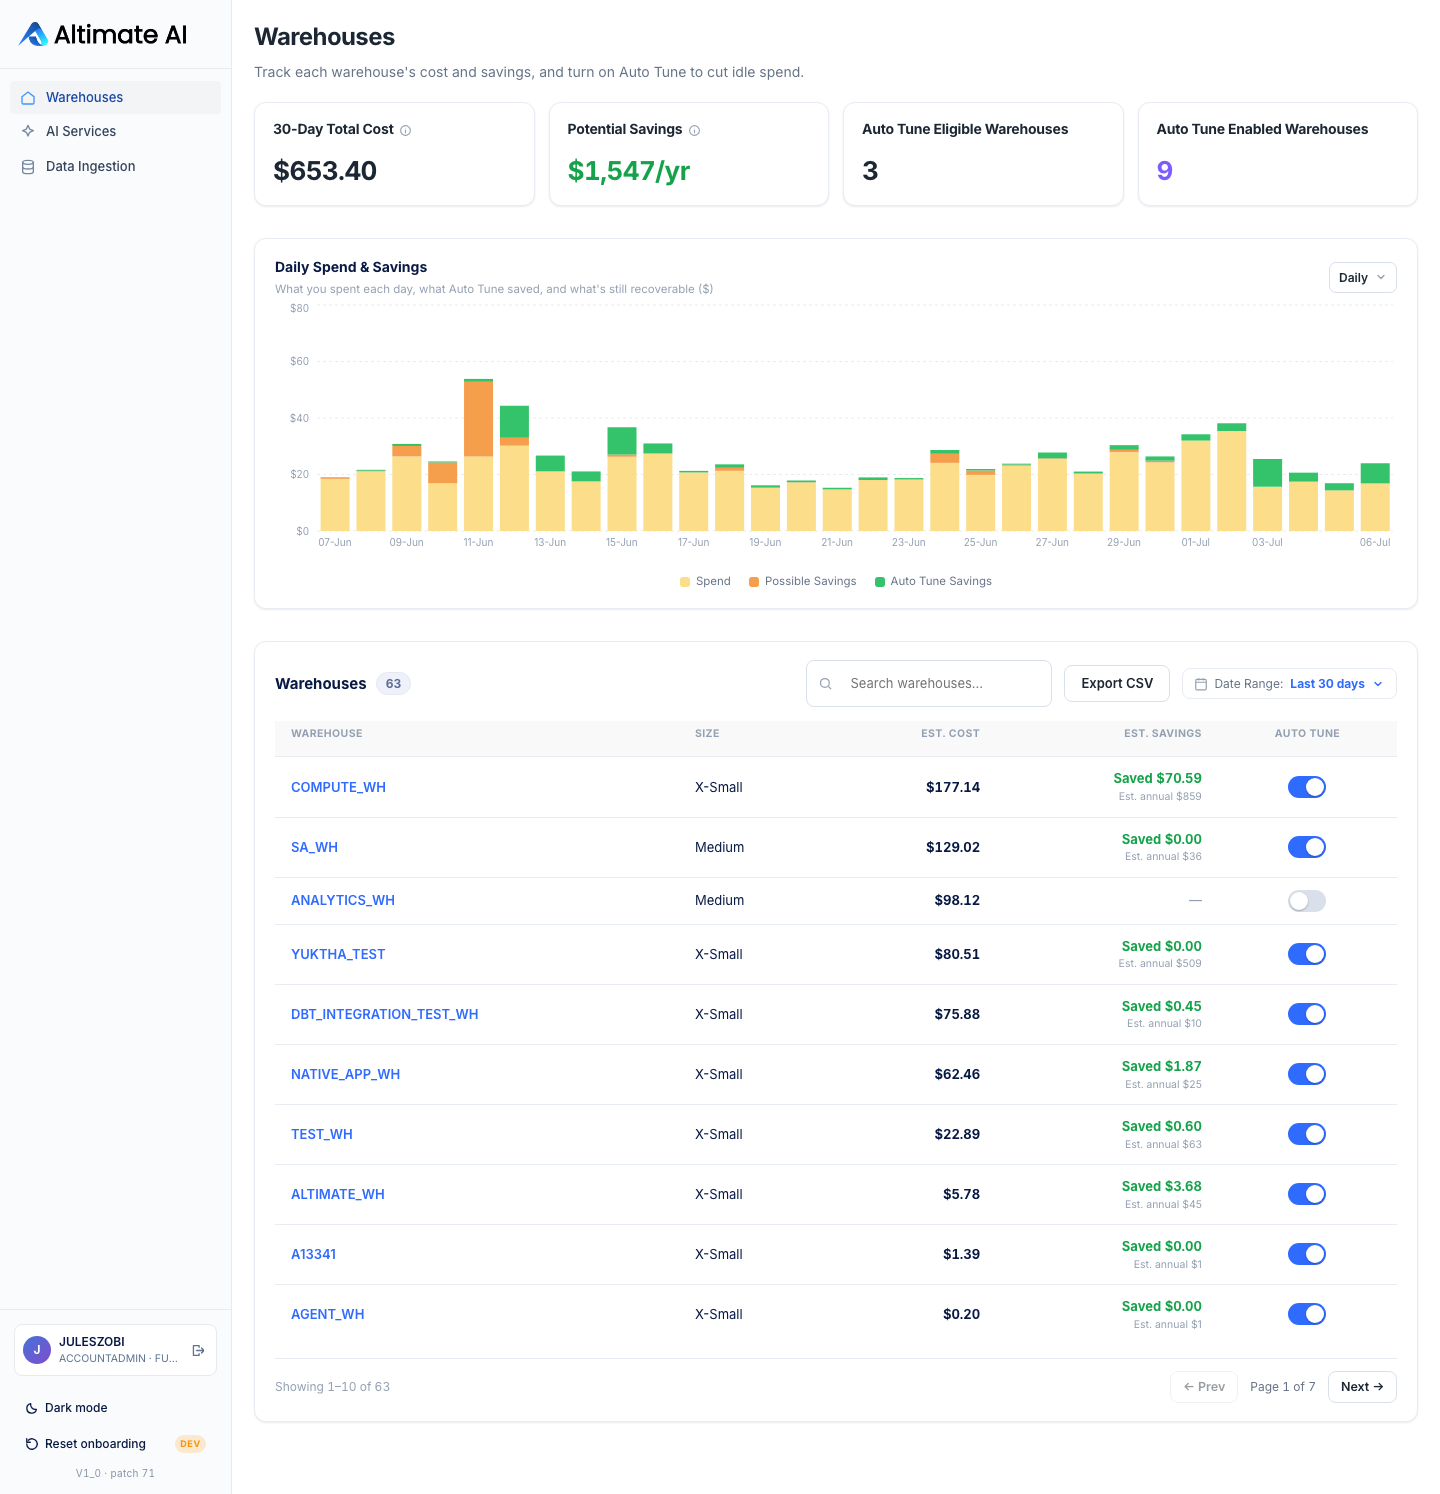
What you get
Total cost
Spend across every warehouse for the period you pick.
Potential savings
An annualized estimate of what Auto Tune could save across every warehouse, combining savings already captured with savings still on the table.
Eligible warehouses
How many warehouses could be tuned but aren't yet.
Enabled warehouses
How many warehouses have Auto Tune turned on right now.
Turning on Auto Tune
Every warehouse in the list has an Auto Tune toggle. Flip it on and Altimate continuously tunes that warehouse to real usage: it suspends the moment the warehouse goes idle and scales down clusters the instant demand drops, so spend always tracks actual workload instead of a static setting. Nothing else about the warehouse changes. Snowflake-managed warehouses (e.g. Adaptive Compute) aren't eligible.
If the app doesn't yet have the grant it needs on a given warehouse, toggling it on shows the exact GRANT MONITOR, MODIFY ON WAREHOUSE ... statement to run. Copy it into a worksheet, run it as a role that can grant on that warehouse, then try the toggle again.
Seeing your savings
Each warehouse row shows either "Saved $X" (Auto Tune is on, money already captured) or "Potential $X" (Auto Tune is off, an estimate of what turning it on would save), each with an annualized figure underneath. Export CSV next to the search box downloads the full table.
Reading the daily chart
The Daily Spend & Savings chart (on the overview and again on every warehouse's detail page) stacks three colors per day:
- Yellow, Spend: What that warehouse actually cost that day.
- Orange, Possible Savings: Idle spend Auto Tune could still recover, on warehouses where it's off (or hasn't caught everything yet).
- Green, Auto Tune Savings: Idle spend Auto Tune already recovered that day.
A tall yellow bar with a big orange cap means real, uncaptured savings sitting on the table: a good candidate to turn Auto Tune on. A bar that's mostly green means Auto Tune is already doing its job there.
The warehouse detail page
Click any warehouse name for the full picture.
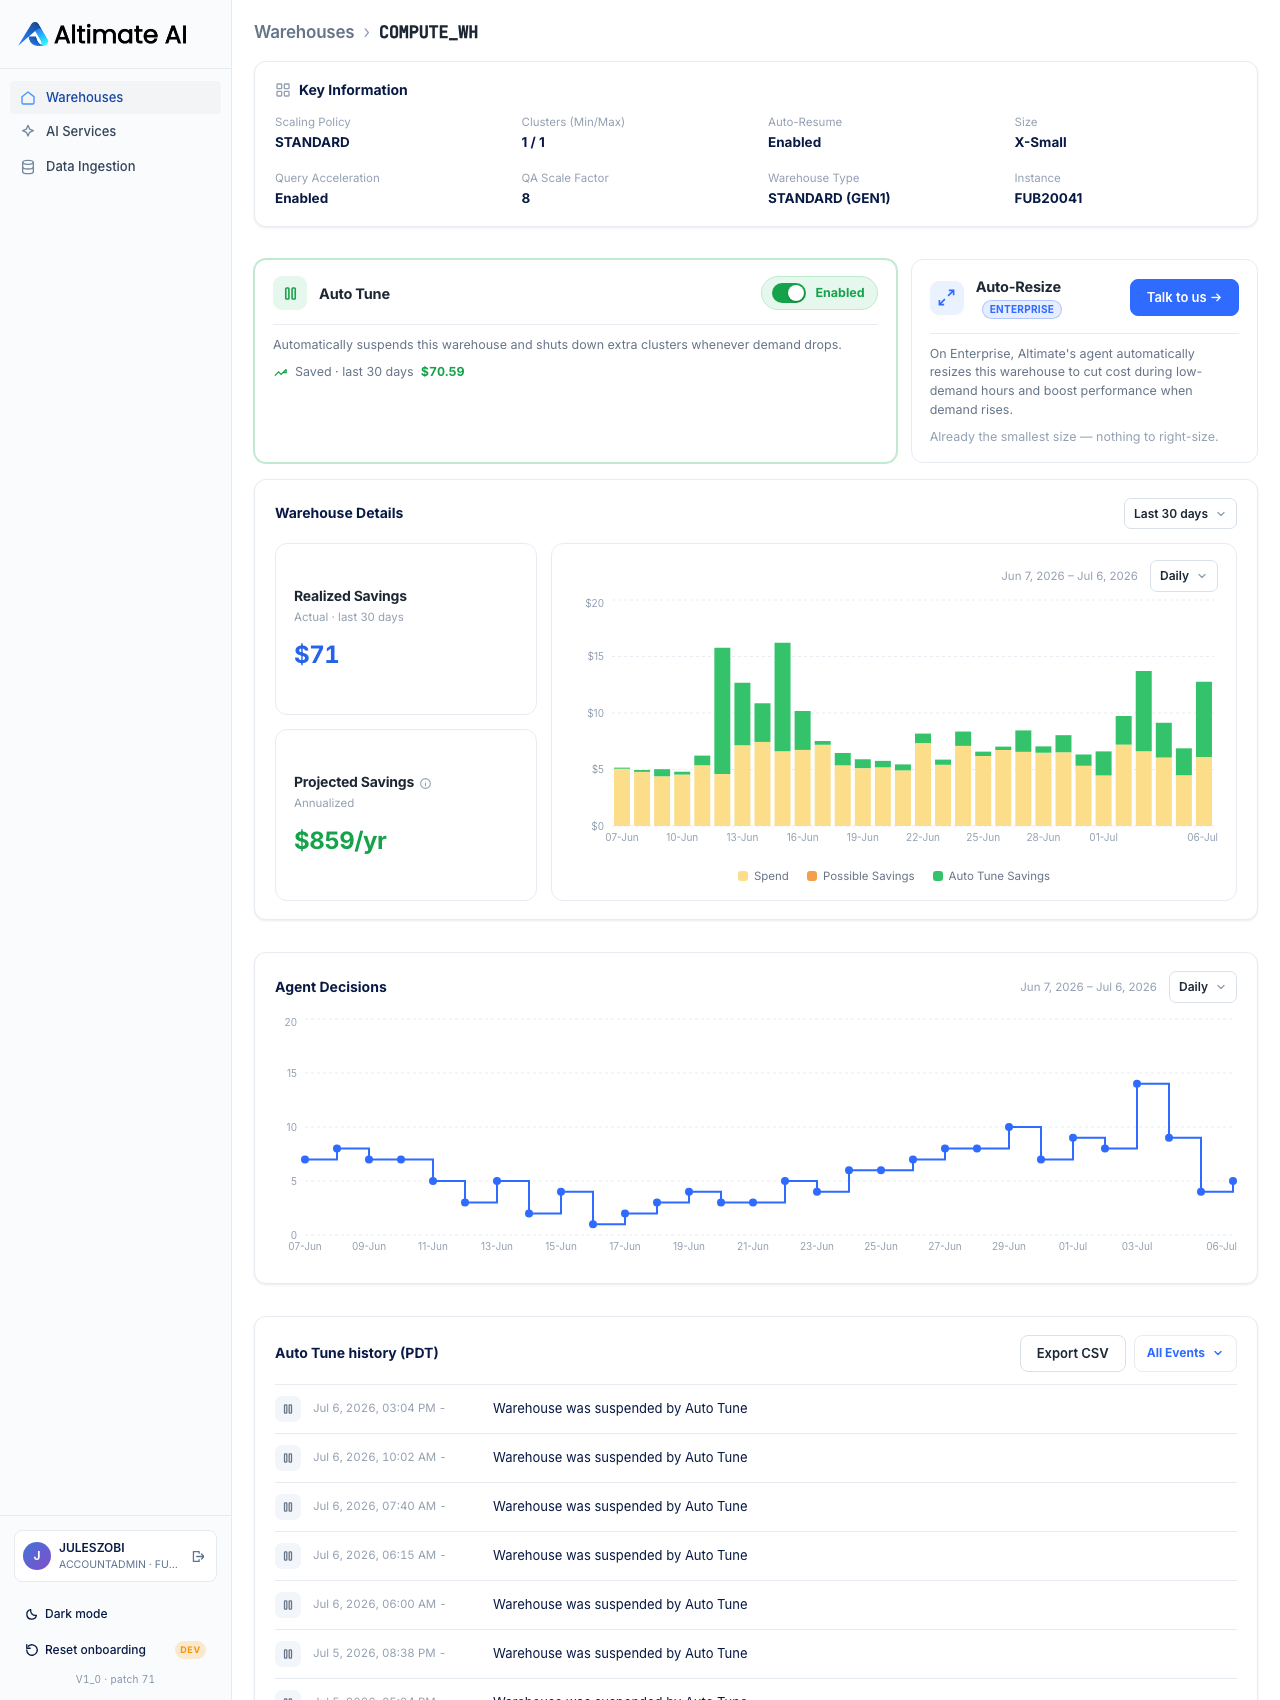
- Key Information: The warehouse's real Snowflake settings (size, scaling policy, clusters, auto-resume, query acceleration) at a glance.
- Auto Tune: The same toggle as the list. Once it's on, this warehouse is tuned to real usage continuously: suspended the moment it's idle, scaled down the instant demand drops, and shows "Saved · last N days" for the currently selected window.
- Realized Savings vs. Projected Savings: Realized Savings is actual dollars recovered in the window you've selected; Projected Savings is always an annualized estimate, so the two use different time bases on purpose. One tells you what already happened, the other what a full year looks like at the current rate.
- Agent Decisions: How often the tuning agent has acted on this warehouse over the window; spikes line up with the events below. Hover any point for the exact date and count.
- Auto Tune history: A timestamped log of every decision: "Warehouse was suspended by Auto Tune" (idle → suspended), "Warehouse was scaled down by Auto Tune" (active cluster count reduced), "Resized from X to Y" (size changed), and "Auto Tune turned on/off" (you flipping the toggle). Filter it to one event type from the dropdown when you're trying to answer "did it ever scale this down?" instead of scrolling everything, and use Export CSV to pull the log into a spreadsheet.